

We created a Google Analytics dashboard that covers all of these topics. This post reviews each of the 12 widgets, how you can create them, and a link so you can try out the complete dashboard on your site in one click.
On each Google Analytics Dashboard you can include up to 12 widgets. These are our favorites to give you a good general overview of your site.
While these widgets are helpful for everyone, here is a little about the sites I manage and why this dashboard was developed:
- I typically do no use Adwords on my site, so I focus more on organic search rather than paid search
- I have chosen to avoid including goal on this overview dashboard. If you use goals on your site feel free to swap out any of these widgets with ones that highlight your goals.
Site Overview Dashboard
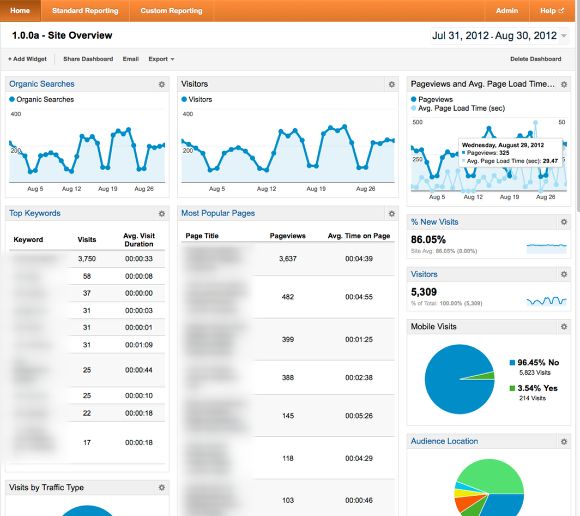
Add Site Overview Dashboard:
Use the link below to add this dashboard to your Google Analytics Account. The process is super easy. Give it a go...
Widget 1 -- Organic Search Volume Timeline
Goal: Get a good overview of the Organic Search Traffic Trends
Most of the sites I manage rely heavily on Organic search traffic, which is why I like to keep this widget right at the top of the dashboard.
It allows me to spot any increase or decrease in organic search traffic. Typically I use this to make sure that nothing major has gone wrong with they search engine. If I see big drop in traffic, I know something has gone wrong and it it time for some additional research.
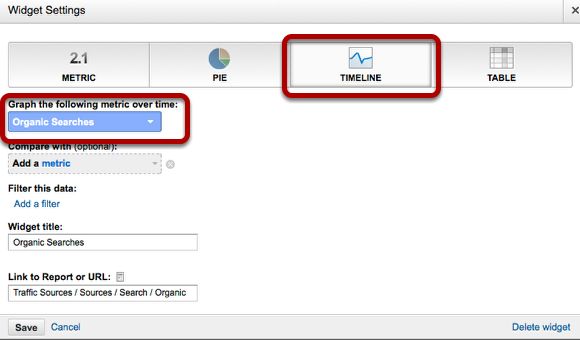
Setup:
- Set the widget to "TIMELINE"
- Set the dimension to "Organic Searches"
Widget 2 -- Top Keywords Table

Goal: See The top Search Terms bringing visitors to my site
After I have seen the trend for search traffic, it is time to look at the top keywords. After you look at this widget long enough you will start to notice the number of visitors for each term and will have a feel if you are getting more or less traffic for each term.
Setup:
- Set Widget to "TABLE"
- Set the Dimension to Keyword and first metric to Visits, second metric to Avg. Visit Duration
- Set the filter data. For my example I am filtering on organic, an additional option is to hide the (not provided) keywords. I like to see how big the not provided keyword number is so I do not filter this data out.
Widget 3 -- Visits by Traffic Type Pie Chart

Goal: Get a feel of how all visitors are getting to the site
Now I have a good feel for the search/keyword trends, it is time to get an overview of all the traffic that is coming to the site whether it is organic traffic, referral or direct type traffic.
I like the pie charts because they are simple and easy to understand at first glance. You will typically see traffic sources like: organic, referral, direct, and maybe a social networks like twitter.
Setup:
Set the widget to "PIE"
Set the Metric to "Visits" and group by "Traffic Type" I typically leave this pie chart at 6 slices.
Widget 4 -- Top Referring Sites Table

Goal: Get more detail on where your traffic is coming from
The Traffic Pie Chart is great because it give you a quick overview. Now it is time for further detail on exactly what sites your visitors are coming from. The top of the list will most likely be search engine and then going to social network or maybe referrals from other websites.
Setup:
- Set the Widget to "TABLE"
- Set the Dimension to "Source / Medium" and the metrics to "Visits" & "Avg. Visit Duration" for the second metric can be set to "Pages / Visit" if that is more interesting to you.
Widget 5 -- Visitor Timeline

Goal: Spot Visitor trends
I like to to put this one at the top of the second column so it is front and center when I check on my sites. Now I can easily see both the organic search and Visitor trends. They usually look similar to each other but from time to time I will see variations. There is the option to add a second metric, I typically keep it to just visitors to keep the clutter and confusion to a minimum.
Setup:
- Set the widget to "TIMELINE"
- Set the dimension to "Visitors"
Widget 6 -- Most Popular Content Table
Goal: See the top content along with number of Pageviews and average time on page
Now we are starting to get to the content and how often pages are being viewed. Here you can see the most popular pages on your site. Hopefully there are no surprises but from time to time you may learn that others find a particular page much more interesting than you thought it is. I also like adding Avg. Time of Page metric because you can see how interesting people find that page. The longer they stay there the the better the page is.
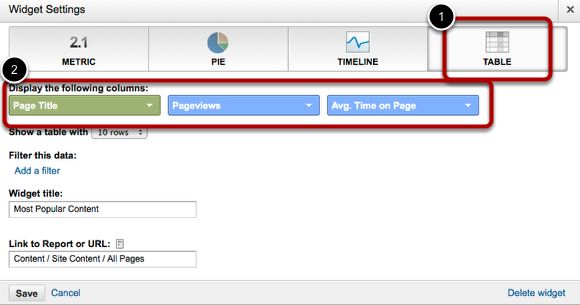
Setup:
- Set the widget to "TABLE"
- Set the dimension to "Page Title" and the metrics to "Pageviews" and "Avg. Time on Page"
Widget 7 -- Top Landing Pages

Goal: See which pages are ranking high in the search engines and bringing you visitors
Now that we have see the top content it is time to see which pages are bringing in the most traffic. Here we can see the top landing pages / how many entrances they are getting and what the bounce rate is. All good metrics for understanding how many visitors are landing on each page an what they are doing once they get there.
Setup:
- Set the widget to "TABLE"
- Set the dimension to "Landing Page" and the metrics to "Entrances" and "Bounce Rate"
Widget 8 -- Pageviews and Avg. Page Load Timeline

Goal: Spot the page view trends and compare them against page load time
Now I usually start the third column with this widget, that way I have three timelines at the top of my dashboard. Also I add Avg. Page Load Time as a second metric. On several occasions I have seen the pageviews drop when the page load time goes up. It makes sense, do you like waiting for pages to load. If you spot this trend time to start seeing what is going on with the server.
Setup:
- Set the widget to "TIMELINE"
- Set the dimension to "Pageviews" and you can optionally set the compare value to "Avg. Page Load Time (sec)
Widget 9 -- Visitors

Goal: See Total number of Visitors
This is a straight forward widget that shows you the total number of visitors. This may or may not be helpful to you but it is generally a pretty good number to know.
Setup
- Set widget to "METRIC"
- Set Dimension to "%Visitors"
Widget 10 -- % New Visits

Goal: See Percent of New Visits
This is a straight forward widget that shows you the percent of new visitors your site gets. This may or may not be helpful to you but it is generally a pretty good number to know.
Setup
- Set widget to "METRIC"
- Set Dimension to "%New Visits"
Widget 11 -- Mobile Visits

Goal: See how many and what percent of your visitors are on mobile devices
Everyone knows it, mobile is becoming much higher percentage of all web traffic, and now you can see what percent of your visitors are on mobile devices. This is great to know because it will help you determine if it is worth optimizing your site for mobile or adding a responsive template.
Setup:
- Set the widget to "PIE"
- Set the dimension to "Mobile"
Widget 12 -- Audience Location

Goal: See where your audience is physically located
This widget give you a good idea about where your audience is located in the world. Depending on your site it may or may not be helpful. For me it is good to see the countries b/c it helps me determine the best CDN solution and if a CDN is even needed.
Setup:
- Set the widget to Pie
- Set the dimension to "Visits" and group it by "Country / Territory"